- Bolin Centre
- Data
- Oden data repository
- Data from expedition ASCOS, Arctic Ocean, 2008
Ocean turbulence data from the high-Arctic ASCOS expedition 2008
Anders Sirevaag
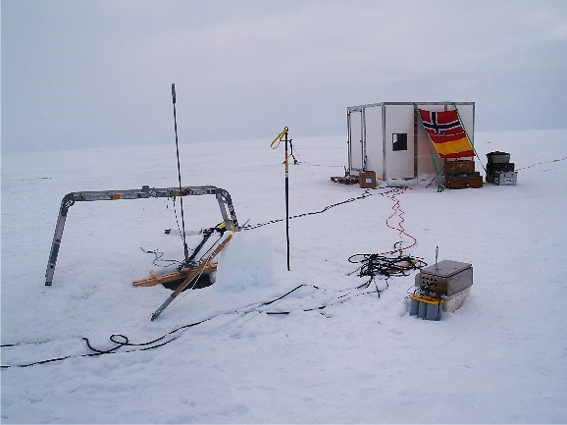
Upper ocean turbulence data was measured at the ocean site of the ice floe roughly 100 m from the Icebreaker Oden, using instruments mounted in a tower deployed through a hole in the ice. The data set contains mean temperatures, salinities, horizontal current velocities and turbulent fluxes of heat and salt in the upper ocean mixed layer. Turbulence data are obtained using Turbulence Instrument Clusters (TICs) at several levels.
Download data
Visit web site
Citation
Anders Sirevaag (2018) Ocean turbulence data from the high-Arctic ASCOS expedition 2008. Dataset version 1. Bolin Centre Database. https://doi.org/10.17043/oden-ascos-2008-ocean-turbulence-1
References
Tjernström, M. et al. 2014. The Arctic Summer Cloud Ocean Study (ASCOS): overview and experimental design. Atmospheric Chemistry and Physics, 14, 2823–2869. https://doi.org/10.5194/acp-14-2823-2014
Data description
Mean temperatures, salinities, horizontal velocities, heat fluxes, salt fluxes and friction velocities for the upper ocean mixed layer.
Please refer to the attached Readme file for more information.
Contact: [javascript protected email address]
Comments
To measure the turbulent fluxes under the ice, a tower was deployed through the ice some 100 m away from the ship. This data set contains mean temperatures, salinities, horizontal current velocities and turbulent fluxes of heat and salt in the upper ocean mixed layer
Turbulence data are obtained using so called Turbulence Instrument Clusters (TICs) at several levels deployed through a hole in the ice. Each TIC comprises an Acoustic Doppler Velocimeter, a 5 Mhz ADVOcean manufactured by Sontek/YSI, that measures 3-D velocity in a small volume close to the tip of the instrument. In addition, each TIC is equipped with a SBE-3 temperature sensor, a SBE-4 conductivity sensor and a SBE-7 micro-conductivity sensor, all manufactured by Seabird Electronics. TIC 2 (at 6 m depth) was setup with a SBE-5 pump for pumped measurements of conductivity and temperature. TIC 3 only contained one single ADVOcean. The figure shows the setup and parameters measured at each depth.
Data are sampled at 2 Hz for TIC 1 and TIC 3, while TIC 2 sampled at 8 Hz. After the initial sampling, data are split in 15 min intervals in order to capture the covariance in the turbulent eddies with time scales on the order of minutes. Within each interval, velocity is rotated into a streamline coordinate system and fluctuating parts of temperature, salinity and the three velocity components are found within each interval.
Original address: http://www.ascos.se/index.php?q=node/252
Files:
Ocean_turbulence.zip (242.11 KB)
Images

Image caption
Photo of the turbulence mast through the ice, holding the under-water mast.
Contact information
Email address
[javascript protected email address]
Phone number
+46 8 16 3110
Postal address
Michael Tjernström
Department of Meteorology
Stockholm University
SE-106 91 Stockholm
Sweden
GCMD science keywords
Earth science > Atmosphere
GCMD location
Ocean > Arctic Ocean
Project
Arctic Summer Cloud-Ocean Study 2008 (Ascos)
Publisher
Bolin Centre Database
DOI
10.17043/oden-ascos-2008-ocean-turbulence-1
Published
2018-10-16 16:24:39
