Ian Brooks
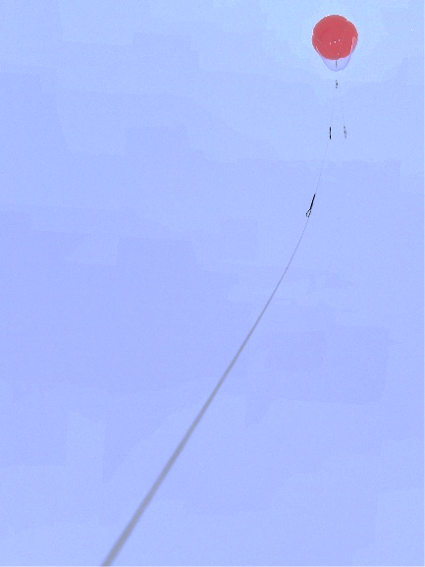
In-situ boundary-layer meteorological observations were made from the ice using sensors hanging under a tethered balloon which was quasi-continuously winched up and down in the ~0 – 600 m layer. The sensor package consisted of a sonic anemometer in an aerodynamic housing and sensors for mean temperature and relative humidity, as well as sensor package movement and orientation. An aerosol sensor was also included and a camera set to take low-rate time lapse photos hang under the tethered balloon. The data include one set of mean profiles and one set of turbulent kinetic energy-dissipation rate; a measure of turbulence derived from the inertial sub-range of wind speed power spectra.
Download data
Visit web site
Citation
Ian Brooks (2018) Tethersonde mean meteorology from the high-Arctic ASCOS expedition 2008. Dataset version 1. Bolin Centre Database. https://doi.org/10.17043/oden-ascos-2008-tethersonde-1
References
Tjernström, M. et al. 2014. The Arctic Summer Cloud Ocean Study (ASCOS): overview and experimental design. Atmospheric Chemistry and Physics, 14, 2823–2869. https://doi.org/10.5194/acp-14-2823-2014
Data description
Data structure contains 10-second averaged data (mean meteorology) from tethersonde on
a continuous time-base. Where sonde is not flying all variables except time are padded
with NaNs.
TS10 =
time: [132455x1 double] - matlab serial time
P: [132455x1 double] - pressure (mb)
T: [132455x1 double] - air temperature (deg C)
RH: [132455x1 double] - relative humidity (%)
Psurf: [132455x1 double] - surface pressure (mb)
palt: [132455x1 double] - pressure altitude (m)
Ts: [132455x1 double] - sonic temperature (K)
WS: [132455x1 double] - mean wind speed (m/s)
Traw: [132455x1 double] - uncorrected air temperature
RHraw: [132455x1 double] - uncorrected relative humidity
Poor ventilation of T/RH sensor resulted in a wind-speed dependent bias. A correction
has been applied to match mean values to those of sensors on 15m mast. Uncorrected values
are also given here.
The sonic temperature (calculated from speed of sound measurement
from sonic anemometer) has a significant bias high, by ~3 degrees. This is apparently a
known issue with Gill sonic anemometers (at least older models). No attempt has been made to
correct it here - while absolute values is biased, relative values within profiles should
be OK.
No wind direction is available as yet.
Ian Brooks
[javascript protected email address]
Comments
To obtain in-situ boundary-layer observations through a deeper layer, a sensors package was deployed hanging under a tethered balloon, and was quasi-continuously winched up and down in the ~0 – 600 m layer. These measurements were only interrupted when weather conditions with dense fog persisted for long periods of time since this was detrimental for the polar-bear watch. The winch was located in “Met Alley” (see Micrometeorology) which this was one (of two) reason why this site was continuously manned.
The sensor package consisted of a Gill sonic anemometer in an aerodynamic housing and sensors for mean temperature and relative humidity, as well a sensor package movement and orientation. A CLASP aerosol sensors was also included but its inlet often froze up when the package was inside clouds. A camera set to take low-rate time lapse photos also hang under the tethered balloon.
The data provided include one set of mean profiles and one set of TKE-dissipation rate; a measure of turbulence derived from the so-called inertial sub-range of wind speed power spectra.
Original address: http://www.ascos.se/index.php?q=node/254
Files:
all_TS10.zip (3.68 MB)
