Elham Baranizadeh, Ilona Riipinen
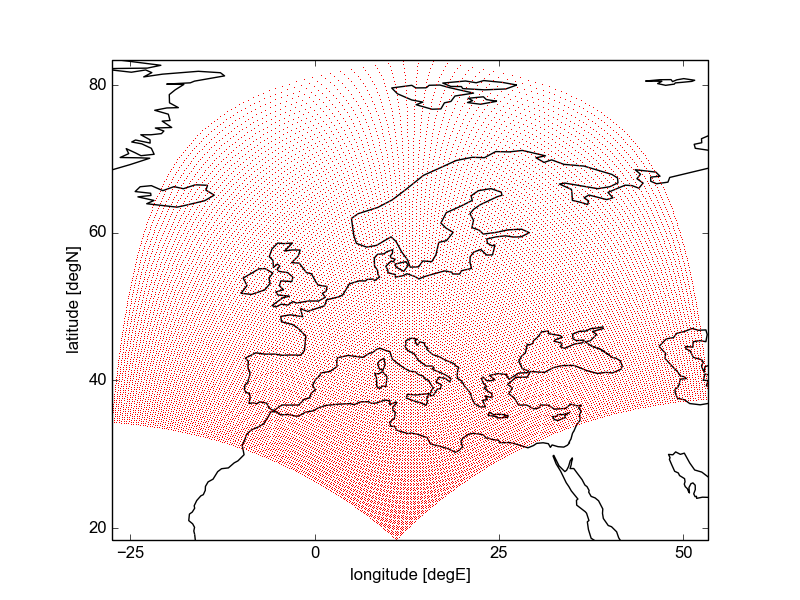
We present simulated data that represent a prediction of the particle number concentrations over Europe, during May 2008.
The scientific motivation is that formation of new particles from atmospheric vapors is potentially an important source of particulate matter in the atmosphere, especially in the ultra-fine (< 100 nm in diameter) size range.
The simulation was made with the three-dimensional chemical transport model PMCAMx-UF, which was up-dated with particle formation rates for the ternary H₂SO₄–NH₃–H₂O pathway simulated by the Atmospheric Cluster Dynamics Code (ACDC) using quantum chemical input data. Results from analysis of the data show that, although the effect of the new cloud adjustment scheme on total number concentrations is small, enhanced new-particle formation is predicted near cloudy regions.
Download data
You can download all files automatically using the software wget and the following single command.
wget -i https://bolin.su.se/data/data/baranizadeh-2022-particle-number-1.txt
You may need to download the software wget.
The command uses wget to download all files specified in a file list. A list of all files is available at https://bolin.su.se/data/data/baranizadeh-2022-particle-number-1.txt
Because of the large data volume (1.1 TiB, 87 files of about 13 GiB each), downloading all files can take can take long time and requires sufficent disk space on your system.
To download a selected subset, you can edit the file list and run wget with your revised list. Alternatively, you can select files for download in the file list below.
Data files
Click on the categories below to view the files. Click on the file links to download each file.
Citation
Elham Baranizadeh, Ilona Riipinen (2022) Simulated surface-level particle number concentrations over Europe, May 2008, using regional chemical transport model PMCAMx-UF. Dataset version 1. Bolin Centre Database. https://doi.org/10.17043/baranizadeh-2022-particle-number-1
References
Baranizadeh E, Murphy BN, Julin J, Falahat S, Reddington CL, Arola A, Ahlm L, Mikkonen S, Fountoukis C, Patoulias D, Minikin A, Hamburger T, Laaksonen A, Pandis SN, Vehkamäki H, Lehtinen KEJ, Riipinen I (2016) Implementation of state-of-the-art ternary new-particle formation scheme to the regional chemical transport model PMCAMx-UF in Europe. Geosci. Model Dev. 9, 2741 – 2754. https://doi.org/10.5194/gmd-9-2741-2016
Jung J, Fountoukis C, Adams PJ, Pandis SN (2010) Simulation of in situ ultrafine particle formation in the eastern United States using PMCAMx-UF. J. Geophys. Res. 115, D03203. https://doi.org/10.1029/2009JD012313
Napari I, Noppel M, Vehkamäki H, Kulmala M (2002) Parametrization of ternary nucleation rates for H₂SO₄-NH₃-H₂O vapors. J. Geophys. Res. 107, 4381. https://doi.org/10.1029/2002JD002132
Data description
This data set includes 4D simulations created for Baranizadeh et al. (2016). The spatial extent of the data set is from 27.5° W to 53.4° E (150 steps) and 18.4° N to 83.4° N (162 steps). The vertical extent is from 56 m to 20.3 km above sea level (14 steps). The temporal extent is from day-of-year (DOY) 122 to DOY 150 (hourly steps). A scientific description can be found in Table 1 of Baranizadeh et al. (2016). At this point, the two data sets Napari-TUV-DE and Napari-RADM-DE mentioned there are not available.
The data files are made available as netCDF 4 file sets with one file per day of May 2008 containing all simulated properties each. Simulated particulate matter is given in 43 size sections by individual variables, e.g., PNH4_5 for ammonia size section 5.
The following table explicitly lists the aerosol size sections described in, e.g., Jung et al. (2010, §13).
| aerosol size section |
lower cut point [µm] |
| 1 |
0.000897998 |
| 2 |
0.001131442 |
| 3 |
0.001425482 |
| 4 |
0.001795996 |
| 5 |
0.002262883 |
| 6 |
0.002850965 |
| 7 |
0.003591991 |
| 8 |
0.004525766 |
| 9 |
0.005701929 |
| 10 |
0.007183537 |
| 11 |
0.009050526 |
| 12 |
0.011403298 |
| 13 |
0.014367519 |
| 14 |
0.018102058 |
| 15 |
0.022807157 |
| 16 |
0.028735038 |
| 17 |
0.036203671 |
| 18 |
0.045613752 |
| 19 |
0.057470076 |
| 20 |
0.072407788 |
| 21 |
0.091228066 |
| 22 |
0.114940151 |
| 23 |
0.144815575 |
| 24 |
0.182456132 |
| 25 |
0.229880303 |
| 26 |
0.28963115 |
| 27 |
0.364912263 |
| 28 |
0.459760606 |
| 29 |
0.579261855 |
| 30 |
0.729823966 |
| 31 |
0.919520766 |
| 32 |
1.158523594 |
| 33 |
1.459648492 |
| 34 |
1.839041977 |
| 35 |
2.31704775 |
| 36 |
2.919296985 |
| 37 |
3.678083508 |
| 38 |
4.634094939 |
| 39 |
5.83859397 |
| 40 |
7.356167461 |
| 41 |
9.268189548 |
| 42 |
14.4244168 |
| 43 |
28.28427125 |
Comments
Table 1 in Baranizadeh et al. (2016) lists two simulations called Napari-TUV-DE and Napari-RADM-DE which were used in that publication but which were not created at Stockholm University and are therefore not included here. Please refer to Napari et al. (2002) for details.
All simulations were carried out for the month May, in particular 2008-05-01 (DOY 122) through 2008-05-29 (DOY 150).
The authors of the Baranizadeh et al. (2016) paper welcome that all users of this dataset cite their article.
