Michael Tjernström
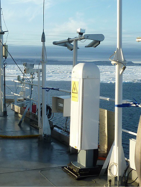
The height to the lowest cloud base, or to more than one cloud base in the case when the lowest cloud layer does not cover the whole sky, was measured by three laser ceilometers. One of these ceilometers was operated as part of the Icebreaker Oden's weather station, located on the deck on 7th deck (approximately 25 m above water) on the starboard side. This system was operated through the whole expedition. When the attenuation of the laser beam reaches a threshold, like in a dense fog, it switches to reporting “vertical visibility”, rather than cloud-base height.
Download data
Visit web site
Citation
Michael Tjernström (2018) Oden ceilometer cloud data from the high-Arctic ASCOS expedition 2008. Dataset version 1. Bolin Centre Database. https://doi.org/10.17043/oden-ascos-2008-ceilometer-oden-1
References
Tjernström, M. et al. 2014. The Arctic Summer Cloud Ocean Study (ASCOS): overview and experimental design. Atmospheric Chemistry and Physics, 14, 2823–2869. https://doi.org/10.5194/acp-14-2823-2014
Data description
The file OdenCloudBase zip-file contains ascii and matlab formated version of the data from Odens celiometer which has been reasonably cleaned up.
There are several issues with this data set and to make things easier the 30-seond data was first reduced to 5-minute medians. After this it was found that, with the capacity to keep track of more than one cloud layer, only two layers gave significant input so only those two are retained, "Layer_1" being the lowest. For both these layers there is a 5-minute median cloud base height and cloud fraction. Keep in mind that with two layers where the lowest is broken, the second higher layer will become the lowest when the lowest temporarily goes away.
Additionally there are also "verical visibility and total cloud cover. The vertical visibility is used when the is dense; for these the cloud base is always at its lowest height, but the verical visibility may still be significantly large; this happens for example in a vertically thin fog, where the horisotnal visibility may be severely restricted but one can still see the sky (or other clouds) through the top of the fog. The cloud cover is given in octas (0-8) where 8 octas is completely overcast. A cloud cover of 9 octas signifies "sky obscured" as in very dense fog.
Note that the "total cloud cover" sems to relate poorly to the cloud cover for either of the layers; have no clue as to why so I suggest using the individual layer cloud cover with caution.
The data in the file is:
1: UTC time (DoY)
2: Year
3: Month
4: Day
5: Hour
6: Minute
8: Longitude (deg)
9: Latitude (deg)
10: Lowest (1st) cloud layer base (m)
11: Lowest (1st) cloud layer fraction (0-8,9)
13: 2nd cloud layer base (m)
11: 2nd cloud layer fraction (0-8,9)
12: Vertical visibility (m)
13: Total cloud fraction (0-8,9)
Obviously Unreasonable values have been replaced by NaN.
Comments
The height to the lowest cloud base, or to more than one cloud base in the case when the lowest cloud layer does not cover the whole sky, was measured by three so-called laser ceilometers. The laser pulse is essentially only reflected in cloud particles and preferentially by liquid water droplets, and is not sensitive to precipitation.
Cloud base heights are given from the surface to the level into the cloud base where the backscatter of the laser light reaches a predetermined level; hence ceilometers from different manufacturers may show slightly different results. Cloud fraction are usually reported in octas; 8 octas is completely cloudy. When the attenuation of the laser beam reaches a threshold, like in a dense fog, it switches to reporting “vertical visibility”, rather than cloud-base height, and the cloud fraction is set to 9. Note that cloud fraction < 9 does not imply absence of fog; the laser beam may on occasion burn through a thin fog layer and detect a higher cloud base aloft.
In addition to the laser ceilometers, a so-called “all-sky cloud imager” ASCOS was also deployed. This consists of a polished half-spherical dome mirror with a camera on top looking down; the camera takes images of the dome, which reflects the whole sky (except the little angle where the camera itself blocks the view). Interpretations of the images results in estimates of cloud type and cloud fraction. Data may be lost if dew or precipitation contaminates the dome.
One ceilometer was operated as part of Oden's weather station, located on the deck on 7th deck (~25 m above water) on the starboard side. This system was operated through the whole expedition.
A second ceilometer (NOAA) was located by the cloud-radar container, on the roof of Oden's foredeck lab. This system additionally recorded the actual backscatter profile, and hence serves as a “poor-man's lidar”.
A third ceilometer (FMI) was located on 7th deck, on the back of the starboard side. This system was only operated during the ice drift.
The “all-sky camera was mounted on the roof of the port container on the 7th deck.
Original address: http://www.ascos.se/index.php?q=node/234
Files:
OdenCloudBase.zip (1.22 MB)
