John Prytherch, Michael Tjernström
Air-sea fluxes and other micrometeorological variables derived from fast response (20 Hz) measurements of the 3-dimensional wind vector, temperature and humidity, and mean meteorological measurements using eddy covariance.
These are rare, direct measurements of the air sea exchange of momentum, sensible and latent heat from sea-ice regions of the Arctic Ocean. They are key parameters in numerous processes, for example, determination of the surface energy balance.
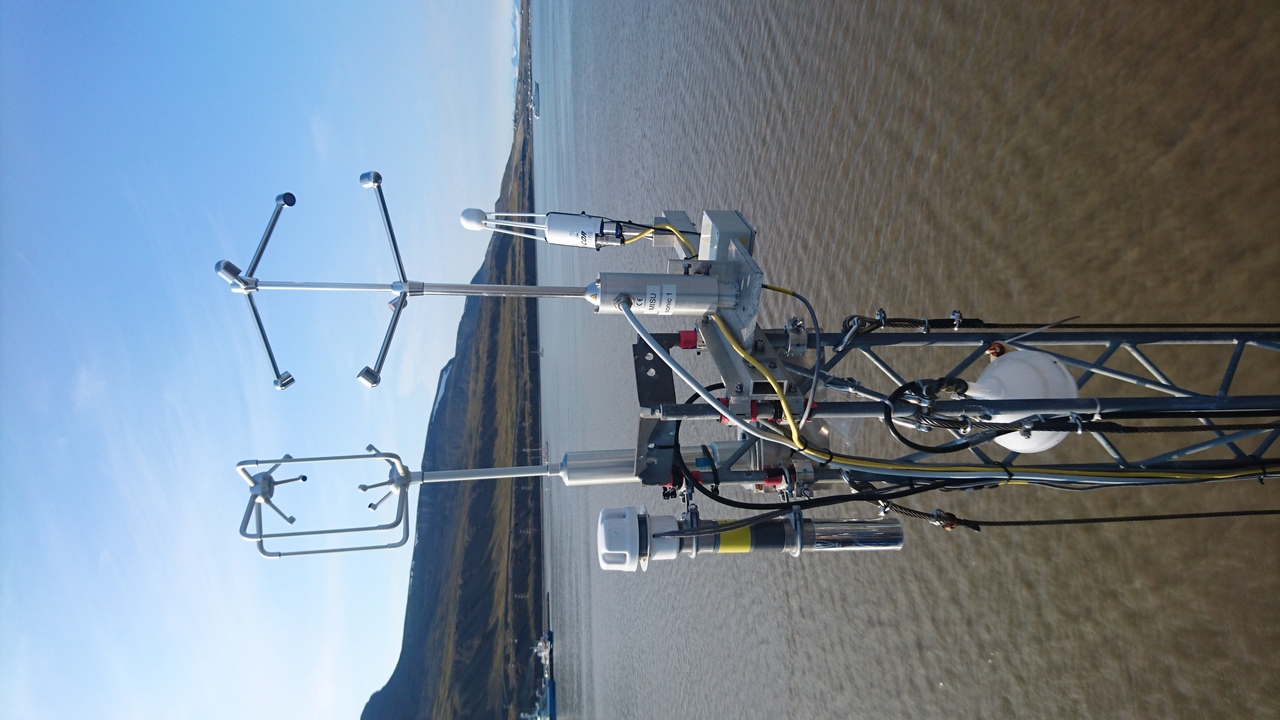
The measurements are from instrumentation mounted on icebreaker Oden’s foremast at approximately 20 m above sea level during the Arctic Ocean 2018 (AO2018, also referred to as MOCCHA-ACAS-ICE) expedition to the central Arctic Ocean in August and September 2018. Eddy covariance fluxes are determined on 30-minute intervals.
Download data
Citation
John Prytherch, Michael Tjernström (2020) Micrometeorological data from icebreaker Oden’s foremast during the Arctic Ocean 2018 expedition. Dataset version 3. Bolin Centre Database. https://doi.org/10.17043/oden-ao-2018-micromet-oden-3
Data description
Micrometeorology data from icebreaker Oden’s foremast, averaged over either 1 or 30-minute intervals. Separate files are included for the two anemometers and for Earth- and ice-relative reference frames. Flux data are not included in the 1-minute files. System operated by John Prytherch and Michael Tjernström (MISU). Three data formats are available: Matlab (.mat), NetCDF (.nc) and comma separated value (.csv) text, with an accompanying readme (.rtf) file.
Comments
The instrumentation on the foremast consisted of a Metek uSonic-3 heated sonic anemometer, a LI-COR 7500 infrared gas analyser, an aspirated TRH sensor, an XSENS MTiG 3-axis inertial motion unit, and a (unheated) Gill R3 sonic anemometer. Other instrumentation included an LGR fast response greenhouse gas analyser installed at the base of the mast with an inlet drawing air at the top of the mast.
Wind measurements were corrected for platform motion following Edson et al. (1998; Direct covariance flux estimates from mobile platforms at sea. J. Atmos. Ocean. Tech, 15, 547-562) and Prytherch et al. (2015: Motion-correlated flow distortion and wave-induced biases in air-sea flux measurements from ships. Atmos. Chem. Phys., 15, 10619–10629).
Winds are measured relative to the ship. The ship acts to distort the wind speed and direction, increasingly so for winds away from bow-on. A computational fluid dynamics (CFD) model of airflow over Oden is used to correct the measured winds for wind directions within 150deg of bow on. An empirical adjustment to the model was derived from a comparison of the foremast wind measurements with those measured on the 15 m mast during the AO2018 ice camp. Winds are then adjusted to Earth frame or ice-relative frame (ice-camp period only) using GPS measurements.
The majority of the fast-response instrumentation measured at 20 Hz. Atmosphere-surface fluxes were determined from the fast-response measurements using eddy covariance. Metek anemometer winds have an aliasing correction applied prior to flux calculation, removing all signal above 5 Hz. The Gill anemometer samples at 100 Hz and averages, and does not require correction.
CO₂ and CH₄ flux and atmospheric concentrations will be published in separate data sets and are not included here.
Quality control flagging follows Foken et al. (2012): Chapter 4 in Eddy Covariance: A practical guide to measurement and data analysis (eds. M. Aubinet, T. Vesala, D. Papale), Springer Atmospheric Sciences, and references therein: Foken and Wichura (1996) and Vickers and Mahrt (1997). Some of the code implementing these was adapted from the Eddycalc suite.
Data from the foremast are combined into a cruise-length file. Separate data files are produced using either Earth Frame winds from the Metek anemometer (foremast), ice-frame winds from the Metek anemometer for the period of the ice camp (foremast-icerel) or Earth Frame winds from the Gill R3 anemometer (foremastR3, 30-minute only). The data are time-averaged to both 1-minute and 30-minute intervals. Flux data are not included in the 1-minute files.
Coordinates (lat, lon) for the observations are not included in this dataset, but they are the same as in the Weather data from MISU weather station during the Arctic Ocean 2018 expedition.
Version history
Version 3
All wind speeds and directions in processing and final data are now strict vector averages.
Version 2
Initial release.
Version 1
Not published.
