Erica Key
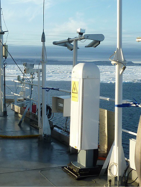
An all-sky cloud imager consists of a polished half-spherical dome mirror with a camera on top looking down. The camera takes images of the dome, which reflects almost the whole sky. Interpretations of the images result in estimates of cloud type and cloud fraction. The imager was mounted on the roof of the port container on the 7th deck onboard the Icebreaker Oden.
Download data
Visit web site
Citation
Erica Key (2018) All-Sky cloud imager data from the high-Arctic ASCOS expedition 2008. Dataset version 1. Bolin Centre Database. https://doi.org/10.17043/oden-ascos-2008-cloud-imager-1
References
Tjernström, M. et al. 2014. The Arctic Summer Cloud Ocean Study (ASCOS): overview and experimental design. Atmospheric Chemistry and Physics, 14, 2823–2869. https://doi.org/10.5194/acp-14-2823-2014
Data description
All-Sky Imager Cloud Data
The all-sky imager consists of a 2π hemispheric mirror and a webcamera in a protective housing, which captures images every 30 seconds of the sky's reflection in the domed mirror. It was installed on Deck 7 on top of the port side container where the view was least obscured by overhead antennae, masts, and other structures. Data are collected 24 hours a day; though, the only images that can be analyzed are those where sufficient daylight is present for the camera to resolve the sky reflection. The data are analyzed in the lab post-cruise by a meteorologist, Mr. Robert Jones, who reviews 10 minutes' worth of images to assess the cloud amount and type at standard meteorological heights. By looking through multiple images over the 10 minute interval, he is able to view cloud movement and see clouds at higher levels through breaks in low-level clouds. Instantaneous analysis of static imagery does not allow for this determination of multiple cloud layers, thereby biasing cloud amount time series to the lowest visible layer. Mr. Jones has performed all of our cloud analyses, removing the random observer bias that results when using multiple analysts.
The cloud time series is presented as an Excel file, with columns of:
1 date ( UTC; m/dd/yy )
2 time ( UTC; hh:mm )
3 low-level cloud fraction ( oktas )
4 low-level cloud type ( see key below )
5 mid-level cloud fraction ( oktas )
6 mid-level cloud type ( see key below )
7 high-level cloud fraction ( oktas )
8 high-level cloud type ( see key below )
9 sun obscuration flag ( 0 means that clouds are in front of the sun, diffusing
radiation; 1 means that the clouds are not in front of the sun)
10 commentary
Key to Cloud Types:
St = Stratus
Cu = Cumulus
Sc = Stratocumulus
As = Altostratus
Ac = Altocumulus
Ci = Cirrus
Cs = Cirrostratus
Cc = Cirrocumulus
While other cloud types may occur, these are the only types identified within this dataset. The amount of each cloud type is identified for that atmospheric height (low, middle, or high) and is quantified in oktas, or eights of the sky. Because of cloud layering, it is possible to have 8 oktas of stratus as low levels and 8 oktas of altostratus at mid-levels. If the cell is blank, it means that no cloud was identified at that level. If the cells under low, mid, and high cloud fraction and type are all blank, and there is no commentary in column 10 indicating instrument failure, darkness, or weather issues, then the sky is considered clear.
Since the camera is imaging the entire sky, it is possible to identify weather events within the daylight data. The commentary column provides indicators of snow flurries, icing events, fog, hoarfrost, and rain, if those occurred during daylight hours during the cruise. It can also be used to determine sunrise and sunset, as it changes over the course of the cruise.
Comments
The height to the lowest cloud base, or to more than one cloud base in the case when the lowest cloud layer does not cover the whole sky, was measured by three so-called laser ceilometers. The laser pulse is essentially only reflected in cloud particles and preferentially by liquid water droplets, and is not sensitive to precipitation.
Cloud base heights are given from the surface to the level into the cloud base where the backscatter of the laser light reaches a predetermined level; hence ceilometers from different manufacturers may show slightly different results. Cloud fraction are usually reported in octas; 8 octas is completely cloudy. When the attenuation of the laser beam reaches a threshold, like in a dense fog, it switches to reporting “vertical visibility”, rather than cloud-base height, and the cloud fraction is set to 9. Note that cloud fraction < 9 does not imply absence of fog; the laser beam may on occasion burn through a thin fog layer and detect a higher cloud base aloft.
In addition to the laser ceilometers, a so-called “all-sky cloud imager” ASCOS was also deployed. This consists of a polished half-spherical dome mirror with a camera on top looking down; the camera takes images of the dome, which reflects the whole sky (except the little angle where the camera itself blocks the view). Interpretations of the images results in estimates of cloud type and cloud fraction. Data may be lost if dew or precipitation contaminates the dome.
One ceilometer was operated as part of Oden's weather station, located on the deck on 7th deck (~25 m above water) on the starboard side. This system was operated through the whole expedition.
A second ceilometer (NOAA) was located by the cloud-radar container, on the roof of Oden's foredeck lab. This system additionally recorded the actual backscatter profile, and hence serves as a “poor-man's lidar”.
A third ceilometer (FMI) was located on 7th deck, on the back of the starboard side. This system was only operated during the ice drift.
The “all-sky camera was mounted on the roof of the port container on the 7th deck.
Original address: http://www.ascos.se/index.php?q=node/292
Files:
ASCOS2008.xls (917 KB)
